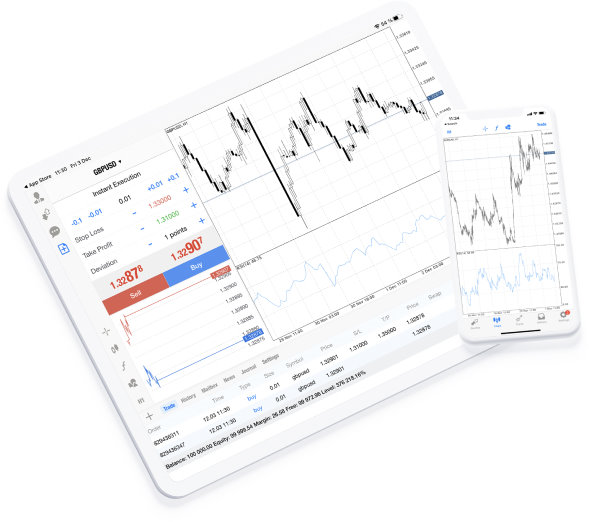
platform remains one of the most powerful and widely used platforms worldwide. Its wide range of tools and customizable indicators allows traders to tailor their strategies and perform precise technical analysis. Whether you’re a beginner or an experienced trader, knowing which features to leverage can make all the difference in refining your trades. Here’s a closer look at some of the best tools and indicators you should explore on MT4.
1. Fibonacci Retracement Tool
The Fibonacci Retracement tool is invaluable for identifying potential support and resistance levels based on historical price movements. By measuring key levels derived from Fibonacci sequences (23.6%, 38.2%, 50%, 61.8%, and 100%), traders can anticipate reversals or continuations in market trends. Whether you’re trading forex, commodities, or indices, this tool gives a mathematical edge for placing stop-loss orders or identifying take-profit targets.
Example Use Case:
Suppose a currency pair has been in an uptrend and begins to retrace downwards. Using the Fibonacci Retracement tool, you might find strong support at the 61.8% level, helping you decide when to re-enter the market for buy trades.
2. Moving Averages (MA)
Moving averages are some of the most versatile indicators available on MT4. They smoothen price data to identify trends more easily and can help you determine potential entry and exit points. Popular variations include the Simple Moving Average (SMA) and the Exponential Moving Average (EMA).
Why Use It:
• Trend Following: Helps confirm whether the market is in an uptrend or downtrend.
• Crossovers: The crossover of two different MAs (e.g., a 50-day and a 200-day) signals potential changes in direction.
For short-term traders, a combination of fast and slow EMAs can be highly effective in identifying opportunities.
3. Relative Strength Index (RSI)
The Relative Strength Index is a key momentum oscillator that measures the speed and magnitude of price changes. RSI values range from 0 to 100, with levels above 70 indicating an overbought market and below 30 indicating oversold conditions.
Best Applications:
• Spotting divergence between price movements and RSI values, which often signals reversed trends.
• Determining whether an asset is overvalued or undervalued.
For traders analyzing volatile markets, RSI is a must-use for timing entries.
4. Candlestick Patterns with Tools
MT4’s chart setup allows traders to view candlestick patterns, which are essential for understanding market sentiment. Analyzing patterns like Doji, Hammers, or Engulfing candles helps traders predict upcoming price movements with high accuracy.
Additionally, mt4 trading platform lets you enhance candlestick analysis with tools such as trendlines and support/resistance levels. Combining these patterns with technical tools often yields a more detailed view of current and future market activity.
5. Bollinger Bands
Bollinger Bands help traders gauge market volatility by displaying three key lines:
• A simple moving average (middle line),
• An upper band (calculated using standard deviation), and
• A lower band.
When the bands contract, it signals low volatility or potential consolidation. Expanding Bollinger Bands indicate increasing volatility and potential breakout setups.
How to Use It:
Many traders use Bollinger Bands to set buy or sell targets when price touches the upper or lower bands, while using the middle band to monitor market direction.
Final Thoughts
The MT4 platform offers an impressive array of tools and indicators that can cater to every trader’s needs, regardless of their experience level. From Fibonacci retracements to RSI and Bollinger Bands, each technical tool provides the insight needed for informed decision-making. Mastering these features enables you to not only track trends but also to fine-tune your overall trading strategy effectively.
By combining these tools with disciplined risk management practices, you’ll gain a stronger edge in navigating the unpredictable movements of the financial markets. Happy trading!

